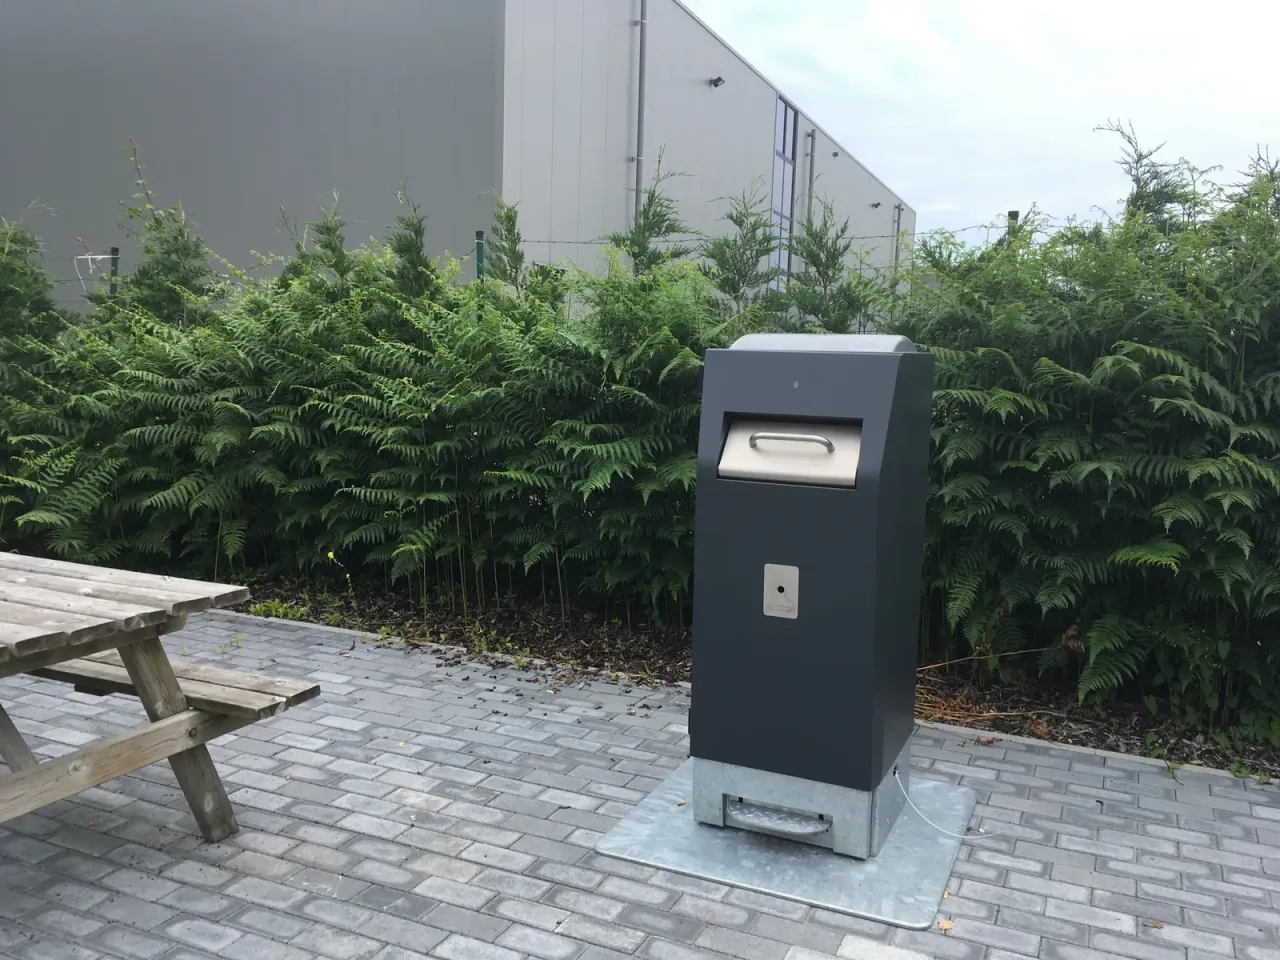
Managing a fleet of hundreds or thousands of bins and containers spread across a territory requires precise organisation. Service managers need to know equipment status, identify points that need intervention and coordinate crews responsible for collection.
When all of these activities run on fixed calendars, manual checks and occasional reports, it becomes difficult to maintain an up-to-date picture of real needs.
Container management software centralises this information, gathers data from sensors and makes it available through maps, notifications and reports.
For municipalities and environmental operators, the benefit is not simply monitoring bins remotely, but being able to organise the service using concrete information on how collection points are used.
In a traditional service, emptying frequency is often defined through calendars, preset routes and direct knowledge of the territory. This approach remains necessary in many situations, but it may not be enough when the number of containers grows or use levels vary significantly from one area to another.
A bin on a little-used street can stay almost empty for several days, while a container near a square, a stop or a tourist area can quickly reach saturation.
Without up-to-date information, the operator risks making unnecessary interventions at some points and arriving too late at others.
Digitisation adds field data alongside ordinary scheduling. It is possible to identify the most critical areas, check how fill levels evolve and assess whether planned frequencies match actual use.
It does not mean dropping calendars or replacing operator experience. It means giving those who coordinate the service an additional tool for more informed decisions.
The value of a platform depends on the quality and relevance of the data available. To manage smart, sensor-equipped containers, the most useful information falls into four areas.
Location and identification of containers
Each device must be linkable to a precise point on the territory and identified uniquely. The map shows how equipment is distributed, distinguishes areas and quickly locates the container a report refers to.
It is important to keep information current when a container is moved, replaced or decommissioned.
Fill level
When the container has a compatible sensor, the platform can receive the measured level and show how it changes. The data helps distinguish points that fill quickly from those that see little use.
Update frequency depends on the device, configuration and connectivity. For this reason it is advisable to know not only the value displayed, but also when the last reading was taken and when the data was transmitted.
The level represents a measure or estimate of occupied volume, not necessarily the weight of the waste. To learn more about devices and supply requirements, see the page on fill-level sensors for bins and containers.
Device status and events
Depending on model and configuration, information may be available on device status, power, battery or events that need attention.
These data help distinguish a container that is genuinely little used from a device that is not transmitting information.
History and trends over time
Consulting only the current value gives a limited snapshot. History makes it possible to see how fill levels change, spot patterns and compare different periods.
This information is useful for recognising areas with usage peaks, checking the effects of events or seasonality and assessing whether collection frequencies are adequate.
A management platform must make information understandable and actionable. Simply collecting data is not enough if managers have to review each point one by one or rebuild the situation manually.
Container map
The map gives a territorial view of the monitored fleet. It helps locate collection points, check their status and recognise areas where critical situations concentrate.
For the service manager it is an overall reading tool; for those working in the field it can be a reference for locating the device targeted for intervention.
Alerts and fill thresholds
Alerts highlight containers that reach configured thresholds. Instead of checking every point continuously, the operator can focus on situations that need verification.
Thresholds should be set according to the service, container capacity and the time needed to intervene.
It is important to distinguish a fill alert from a technical report about the device: the two events require different checks and interventions.
History and reports
Reports make it possible to analyse data collected over time and compare containers, areas and periods. They can support checking emptying frequencies, identifying the most used points and assessing recurring critical situations.
To be useful, they must answer precise operational questions: which containers reach the threshold most often? In which periods does fill level increase? Where do most reports occur? Which points need a frequency review?
Moving from monitoring to planning requires clear procedures. A fill reading does not automatically trigger an intervention: it must be interpreted considering minimum frequencies, contractual constraints, hygiene conditions, crew availability and how routes are organised.
The manager can use the information to identify priority containers, check whether some points are served too often and consider changes to scheduling.
Operators, in turn, must be able to consult guidance and report situations not reflected in the data, such as a damaged container or an unusual deposit.
It is important not to confuse data-supported planning with automatic route optimisation. A monitoring platform can provide levels, maps, alerts and reports; automatic itinerary calculation instead requires specific functionality and further information, such as road constraints, shifts, vehicle capacity and time windows.
The choice of activities to carry out and responsibility for organising the service remain with the operator.
A digital project does not necessarily have to start by replacing every container. In many cases it is possible to combine different devices, provided they are technically compatible with the platform.
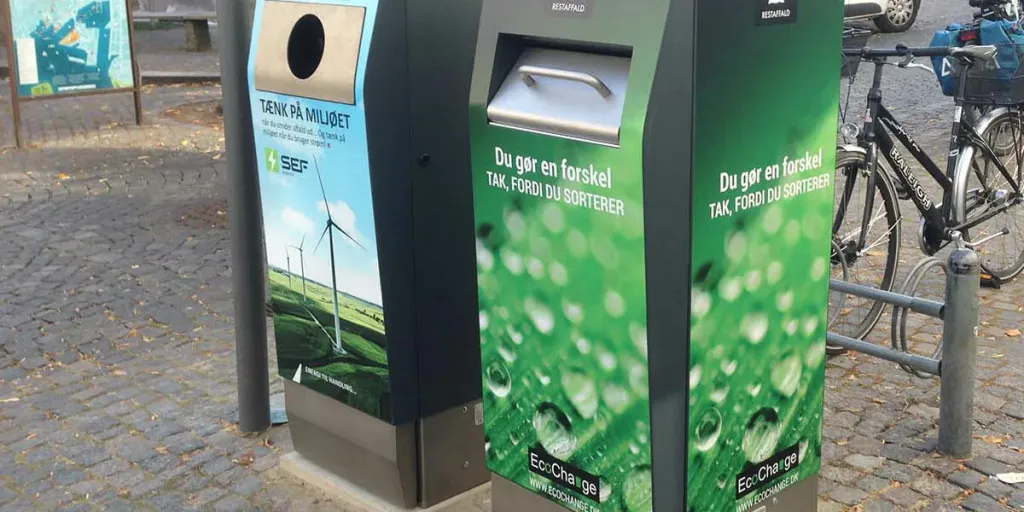
A fleet can include smart compacting bins, traditional containers fitted with sensors and other connected equipment. To compare compaction and sensor-only approaches, read compacting bins or fill sensors: which solution to choose.
Before supply, it is advisable to check which sensors can be connected, what data they transmit, how often and which functions are available for each type.
This approach allows a phased rollout: critical points can be monitored first and the system expanded later, without digitising the whole territory in one go. For objectives, pilots and roles in the public sector, see how to plan a smart bin project for municipalities and operators.
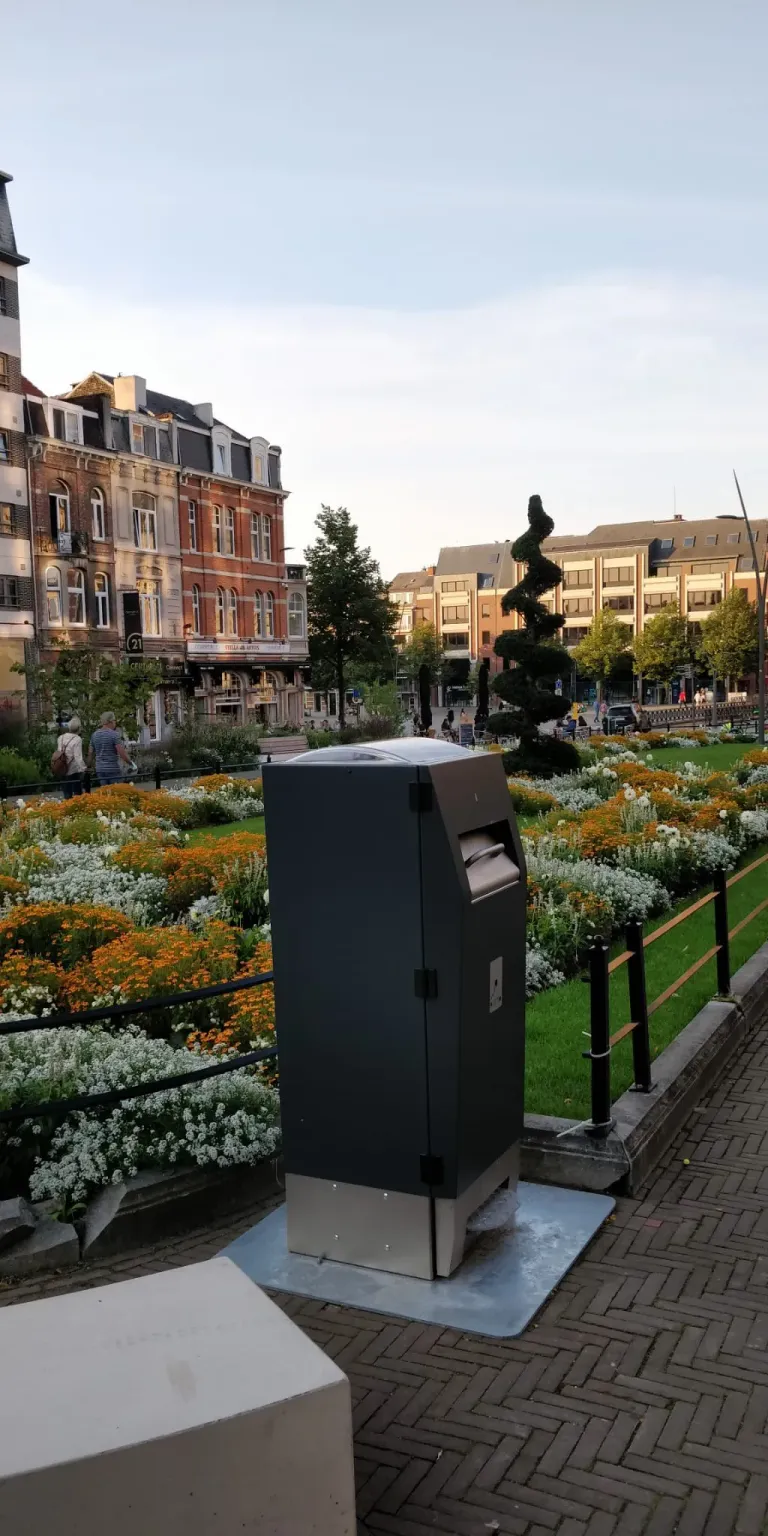
Where capacity is needed beyond monitoring, press models WasteMate 120 and WasteMate 240 can be considered alongside sensors on the rest of the fleet.
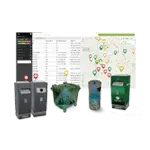
CleanCityManager is the cloud platform offered by Bunder to manage connected WasteMate bins and containers fitted with compatible Sensoneo sensors from a computer or smartphone.
The platform centralises available information and makes it possible to review the monitored fleet through maps, fill levels, alerts, history and reports.
The mobile app also allows field consultation and, depending on configured profiles, management of reports and tickets linked to devices.
Main functions include:
- Container map: view of monitored points and identification of areas that need attention.
- Fill levels: consultation of status reported by connected devices.
- Automatic alerts: notifications when configured thresholds are reached.
- History and reports: data analysis to assess frequencies and critical situations.
- Intervention management: support for organising priorities and reports.
- Web and mobile access: consultation from the office and directly in the field.
Configuration, functional scope, accounts and any licences are defined during the project. Device compatibility and integration options must be verified before activation. Details and setup options are described on the CleanCityManager page.
For a municipality or operator with a large container fleet, it may be more effective to start from a representative area rather than connecting every device at once.
The first phase consists of inventorying containers and identifying those with documented critical issues: frequent emptying, overflow, repeated checks or management difficulties.
Compatibility, network coverage, power and installation methods for devices are then checked.
Once monitoring is active, it is necessary to define who reviews alerts, who decides interventions and how activities are recorded. After an observation period, data can be compared with previous scheduling and a decision made on whether to extend the system.
To measure results, it helps to consider indicators such as:
- number of emptyings per container and per period;
- interventions carried out near saturation;
- reports and overflow situations;
- containers with outdated data or unreachable devices;
- time spent on checks and report handling;
- any changes to routes and resources used.
The assessment should also consider seasonality, events, flow variations and service constraints.
Before purchasing or activating management software, it is useful to define operational needs and verify several characteristics.
Device compatibility. Clarify which sensor and container models can be connected and which data are actually available.
Information updates. Check reading and transmission frequency, coverage, handling of outages and indication of the last update.
Access and roles. Define which functions are available to managers, operators and other users, avoiding unnecessary access.
History and export. Verify how long data are retained, which reports are available and whether information can be exported.
Integrations. If the operator already uses back-office or GIS systems, request documentation on available APIs and formats. Do not assume two platforms integrate simply because both use digital data.
Support and continuity. Clarify support channels, fault handling, updates, service conditions and recurring costs.
These checks help avoid a platform that collects information but does not fit the operator’s processes.